

Electric America
Map U.S. power plants by nameplate capacity over time, then follow hourly generation and transfers between grid regions.
A world is easier to understand when you can move through it. Open an experience and follow your curiosity.
Map U.S. power plants by nameplate capacity over time, then follow hourly generation and transfers between grid regions.
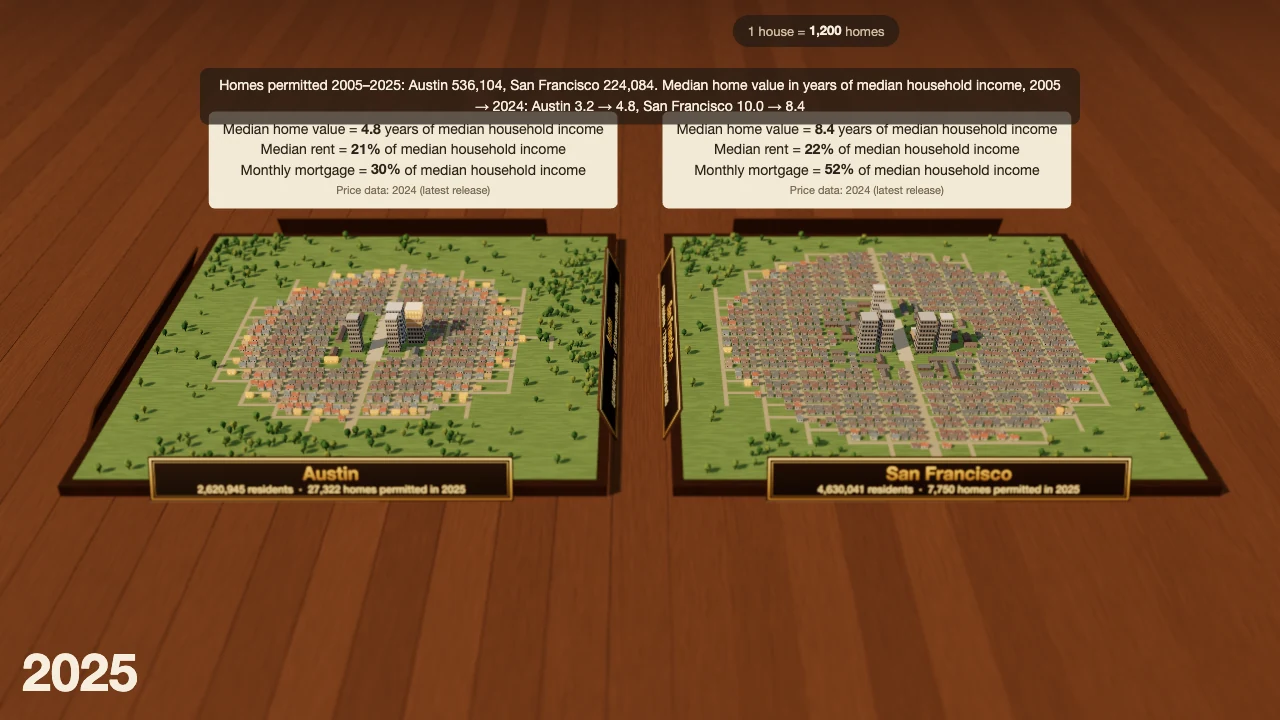
Compare permits, population and housing costs across twelve U.S. metros. Set two cities side by side and watch permitted homes add up year by year.

Trace reported revenue through a glass accounting machine. Explore nine companies across 32 quarters and see how expenses and taxes compare with net income.
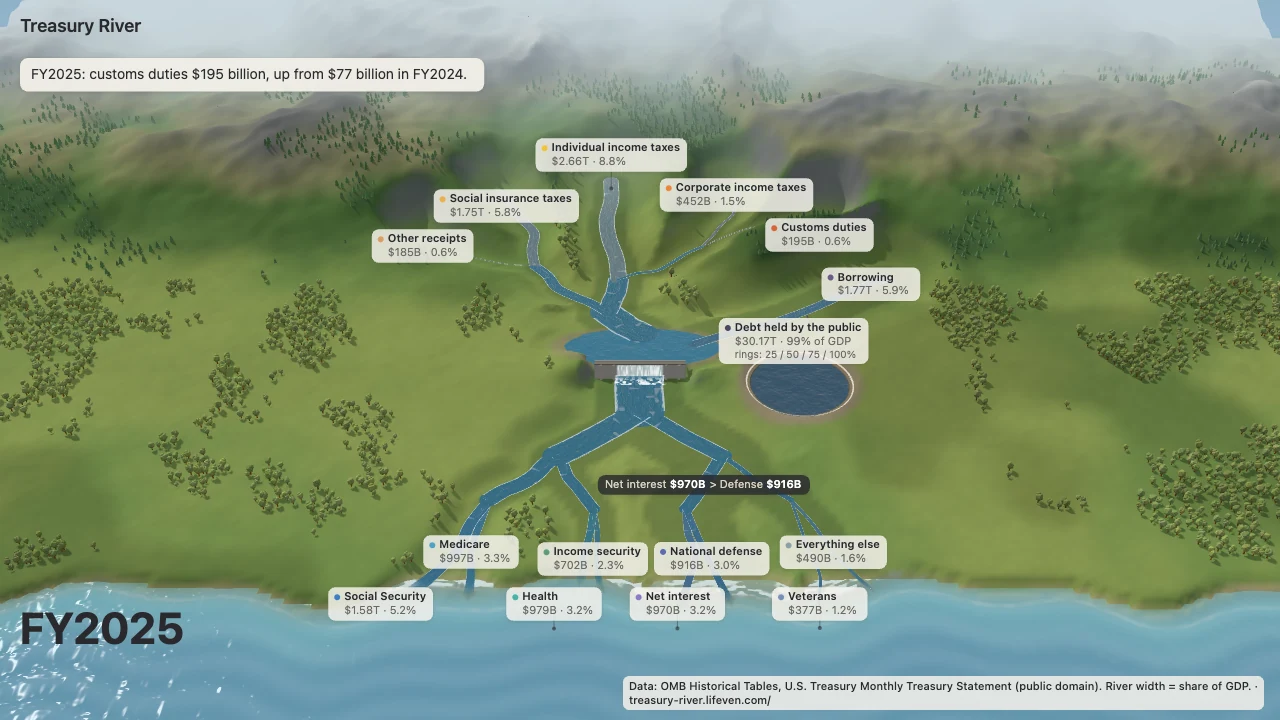
Follow U.S. federal receipts and outlays as they branch into a river system. Explore actual annual figures from FY1940 through FY2025 and monthly statements from 2015 onward.
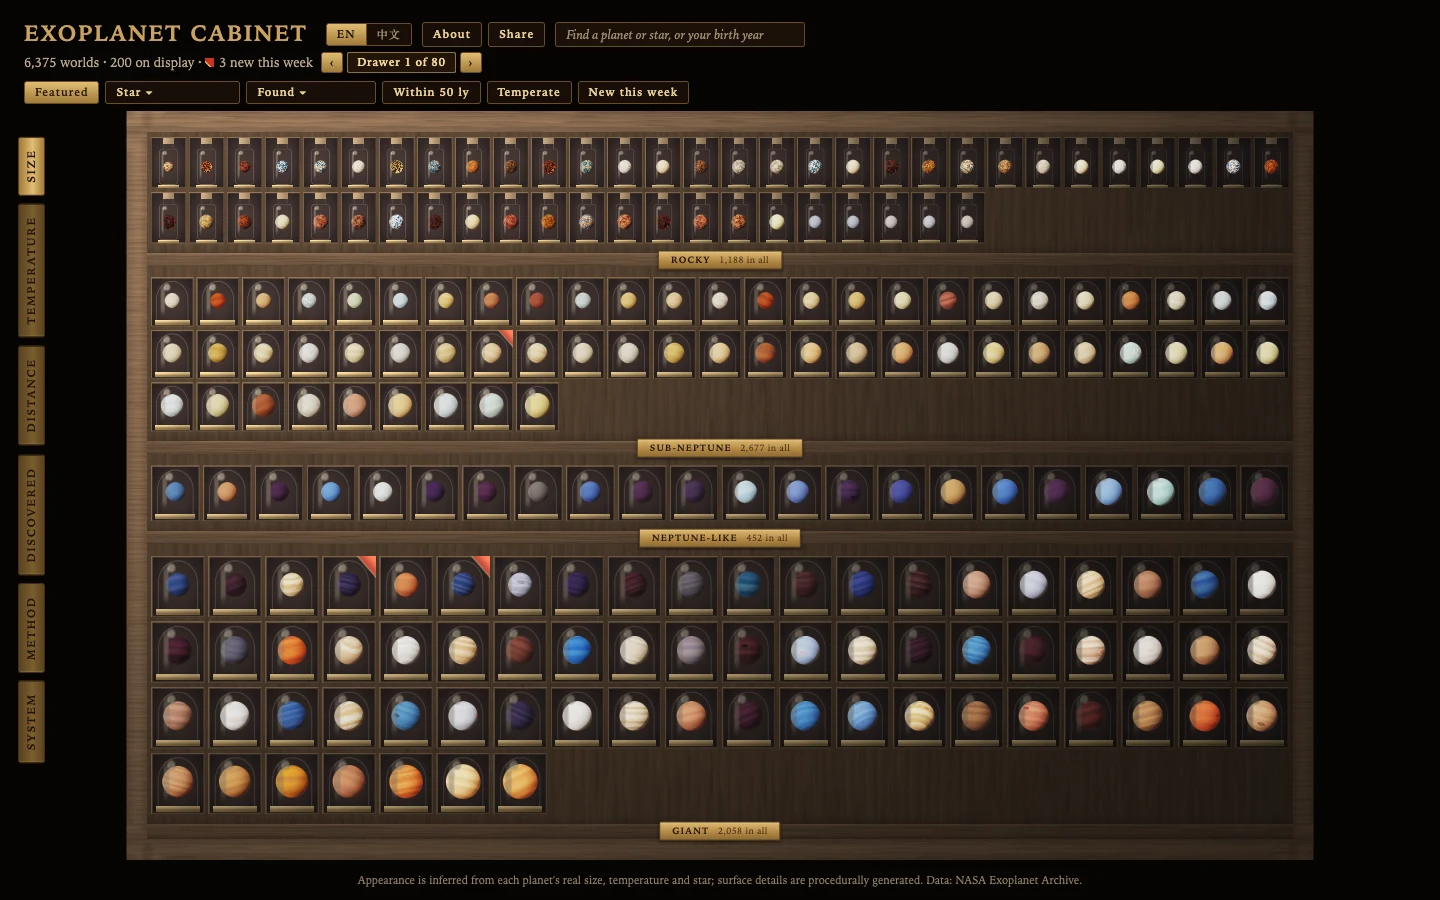
Open a cabinet of known exoplanets. Search for a world, compare its measured properties, and look closer at an appearance inferred from the data.
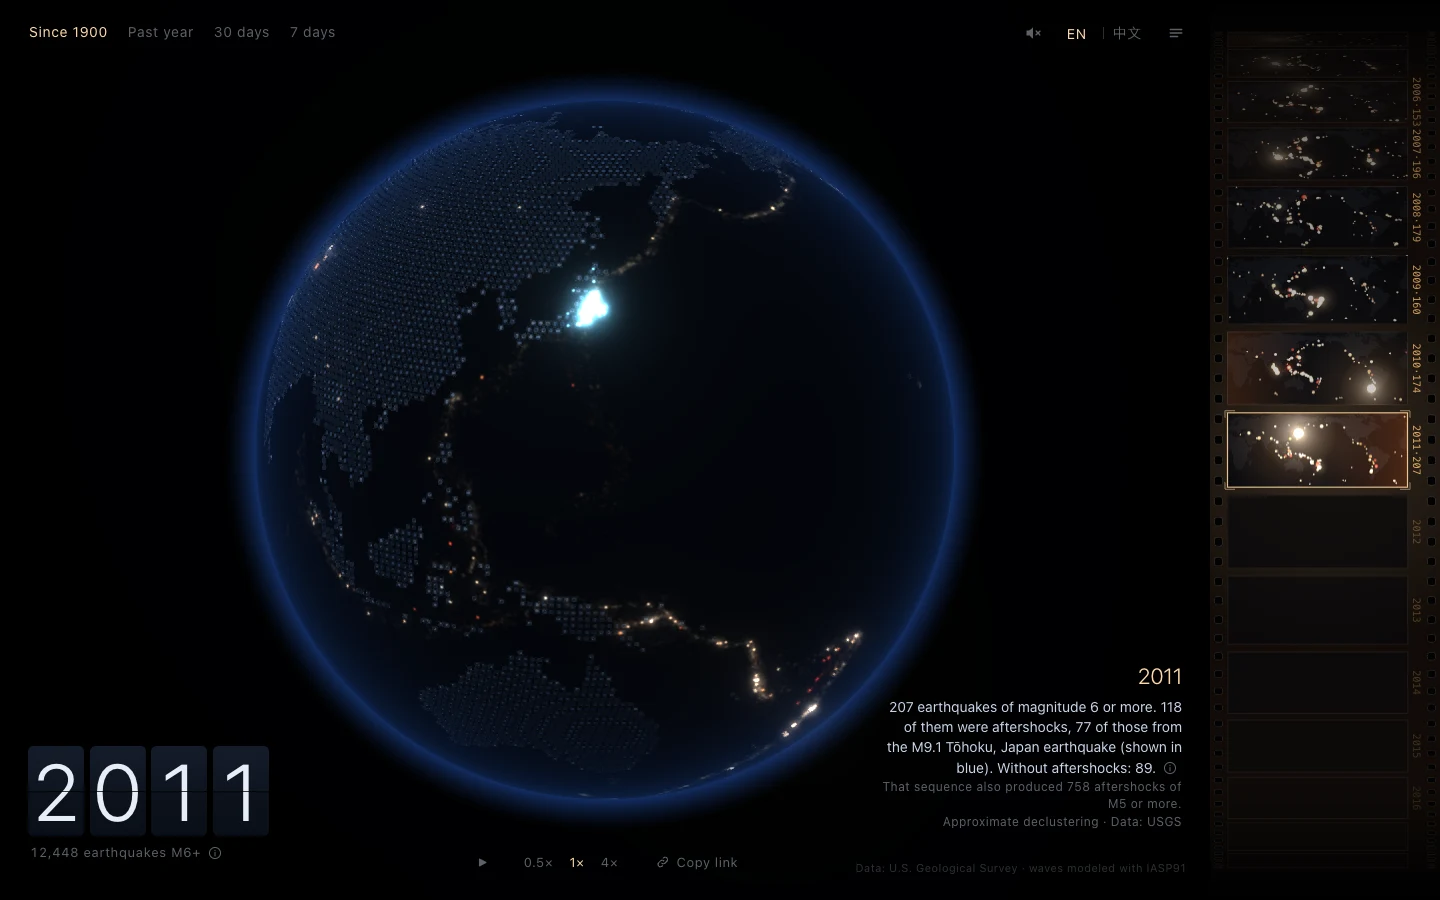
Replay earthquakes on a glowing globe. Move through the years, follow modeled wavefronts, and use the film strip to revisit a moment.
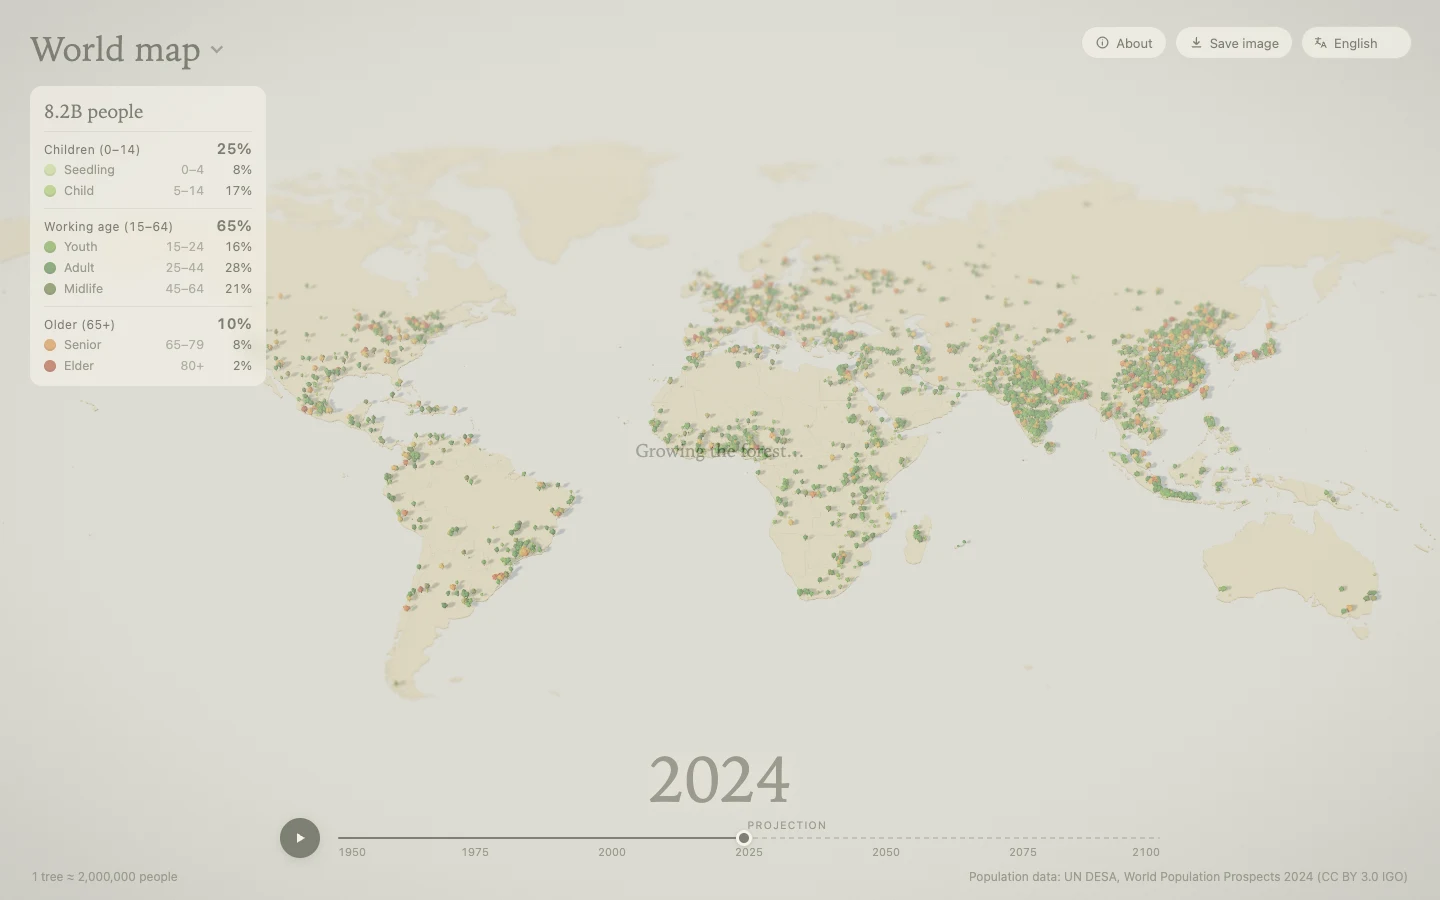
See population as a living forest. Choose a country and move through time as generations grow and age, with estimates and projections from UN data.